| 0:00 |
Owl: Welcome to How to Read Visual Aids, an instructional video on reading comprehension brought to you by the Excelsior University Online Writing Lab. |
| 0:19 |
Are you having trouble understanding visual aids? |
| 0:22 |
Well, you’re not alone! |
| 0:24 |
Don’t fret. |
| 0:25 |
Let’s talk about what visual aids are and how to read them. |
| 0:30 |
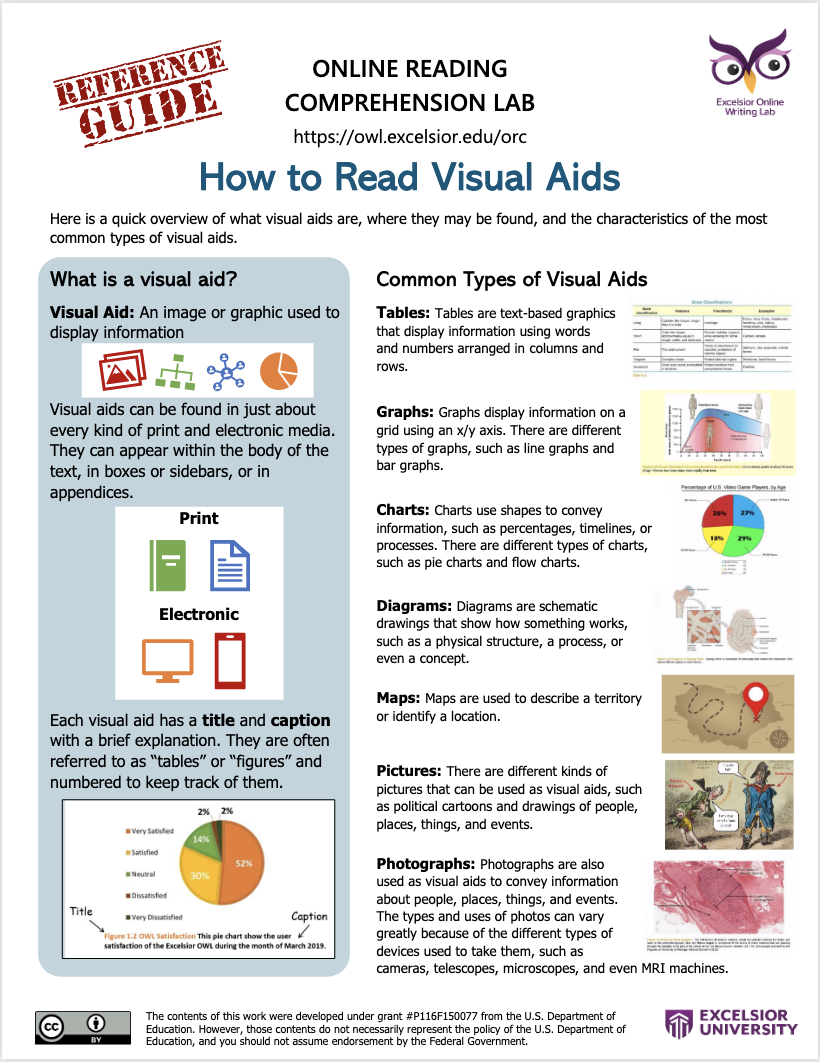
Visual aids are images or graphics used to display information. |
| 0:35 |
Visual aids can be found in just about every kind of print and electronic media. |
| 0:40 |
They can appear within the body of the text, in boxes or sidebars, or in appendices. |
| 0:46 |
Each visual aid has a title and caption with a brief explanation. |
| 0:51 |
They are often referred to as “tables” or “figures” and numbered to keep track of them. |
| 0:58 |
There are several types of common visual aids. |
| 1:01 |
They are tables, graphs, charts, diagrams, maps, pictures, and photographs. |
| 1:14 |
Let’s take a closer look at each one of these to see how they work. |
| 1:18 |
Tables are text-based graphics that display information using words and numbers arranged in columns and rows. |
| 1:25 |
For example, in this table, the first column lists bone classifications, while the first row looks at just one type of bone classification—long bones. |
| 1:37 |
Graphs display information on a grid using an x/y axis. |
| 1:42 |
There are different types of graphs, such as line graphs and bar graphs. |
| 1:46 |
Here’s an example of a line graph. |
| 1:49 |
The x-axis is the horizontal axis. |
| 1:52 |
In this case it measures age in years. |
| 1:55 |
The y-axis is the vertical axis. |
| 1:58 |
In this case it measures bone mass in grams. |
| 2:01 |
By following the two lines, you can find out the bone mass for males and females at different ages. |
| 2:07 |
For instance, the average bone mass of a 30-year-old male is 1500 grams, whereas the average bone mass of a 30-year-old female is just under 1250 grams. |
| 2:20 |
Charts use shapes to convey information, such as percentages, timelines or processes. |
| 2:27 |
There are different types of charts, such as pie charts and flow charts. |
| 2:31 |
Here’s an example of a pie chart. |
| 2:33 |
This pie chart shows the different types of video game players by age group, broken down by percentage. |
| 2:39 |
For instance, the ‘Under 18 Years’ group is only 27%, while the ’18-35 Years’ group is 29%. |
| 2:49 |
Diagrams are schematic drawings that show how something works, such as a physical structure, a process, or even a concept. |
| 2:58 |
For instance, this diagram shows the structure of spongy bone. |
| 3:03 |
Maps are used to describe a territory or identify a location. |
| 3:09 |
There are different kinds of pictures that can be used as visual aids, such as political cartoons and drawings of people, places, things, and events. |
| 3:19 |
Here’s an example of a British eighteenth-century political cartoon by James Gillray that you might find in a history textbook. |
| 3:26 |
Gillray satirizes the decline in manners brought about by the French Revolution. |
| 3:31 |
The cartoon depicts a deposed aristocratic bowing humbly and saying, “I am your very humble servant,” while the revolutionary rudely replies, “Kiss my butt.” |
| 3:44 |
Finally, photographs are also used as visual aids to convey information about people, places, things, and events. |
| 3:52 |
The types and uses of photos can vary greatly because of the different types of devices used to take them, such as cameras, telescopes, microscopes, and even MRI machines. |
| 4:04 |
Here’s an example of a micrograph of cells and tissue in the human body. |
| 4:08 |
The different parts are labeled for clarity. |
| 4:12 |
I hope I’ve given you a better sense of what visual aids are and how they work. |
| 4:16 |
By understanding visual aids, you can greatly improve your comprehension of the many different kinds of texts that use them. |
| 4:24 |
Thanks for listening to this instructional video on How to Read Visual Aids! |
| 4:29 |
Visit the Excelsior University Online Writing Lab for more support with reading and writing skills. |